View built-in reports
Service Buddy includes a full set of reports for the questions most service businesses ask every week. You can open them in a few clicks, filter by date or status, and drill into the details.
Open the Reports page
Section titled “Open the Reports page”- In the main menu, click Reports.
- The reports library shows every report grouped by category.
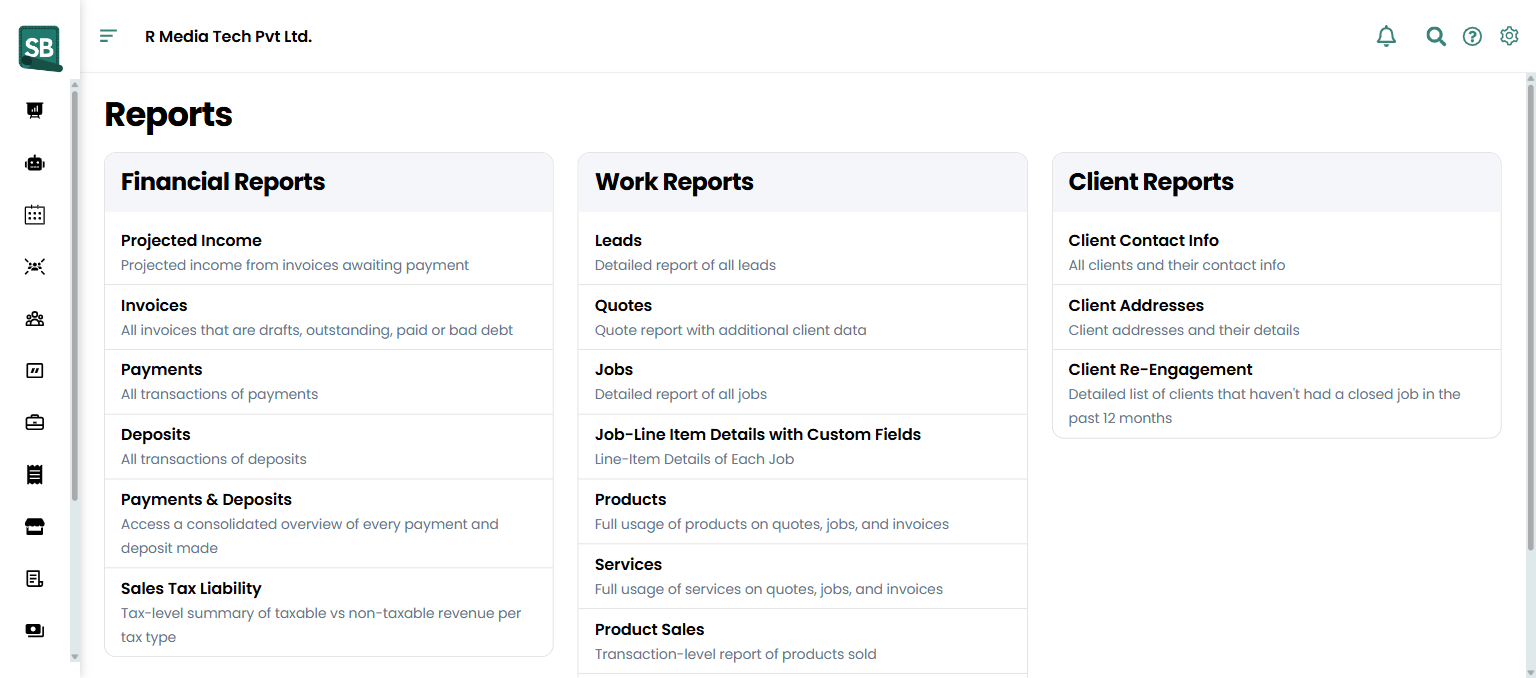
Available reports
Section titled “Available reports”Financial Reports
- Projected Income — revenue expected from invoices awaiting payment.
- Invoices — all invoices: drafts, outstanding, paid, or bad debt.
- Payments — all payment transactions.
- Deposits — all deposit transactions.
- Payments & Deposits — consolidated view of every payment and deposit made.
- Sales Tax Liability — taxable vs non-taxable revenue summary by tax type.
- Commissions — running commission balances per employee, with what’s earned, paid, and pending. See Track commission payouts.
Work Reports
- Leads — detailed report of all leads.
- Quotes — quote report with additional client data.
- Jobs — detailed report of all jobs.
- Job-Line Item Details with Custom Fields — line-item breakdown of each job including custom field values.
- Products — full usage of products across quotes, jobs, and invoices.
- Services — full usage of services across quotes, jobs, and invoices.
- Product Sales — transaction-level report of products sold.
- Service Sales — transaction-level report of services sold.
- Inventory Summary — current stock levels across all inventory items.
- Low Stocks — items below their reorder threshold.
Client Reports
- Client Contact Info — all clients and their contact information.
- Client Addresses — client service addresses and their details.
- Client Re-Engagement — clients who haven’t had a closed job in the past 12 months.
Filter a report
Section titled “Filter a report”- Click the report you want to view.
- Use the Client dropdown to filter by a specific client.
- Use the Status dropdown to filter by status or date field type.
- Use the Date range dropdown to set the time period — this week, last month, this year, or a custom range.
Filters apply automatically as you change the dropdowns — there is no separate Apply button.
Sort and page through data
Section titled “Sort and page through data”- Click any column header to sort by that column. Click again to reverse the order.
- Use the page controls at the bottom to move through long result sets.
- Use the row count selector to show more or fewer rows per page.
What happens next
Section titled “What happens next”- The filtered report stays on your screen — you can change filters or sort order without starting over.
- Totals at the top of each report update automatically based on your filters.
- You can export what you see at any time. See Export report data.
- Save frequent filter combinations by bookmarking the URL in your browser — Service Buddy encodes the filters in the web address.
- For monthly reviews, set the date range to “Previous Month” so you do not pull in partial data from the current month.
- If a report looks empty, double-check your filters — sometimes a default filter (like “paid invoices only”) is hiding the data you want.
Which reports do flooring retailers run most often?
The big four for most owners: Sales Tax Liability (monthly state filing), Payments (reconciling against bank deposits), Inventory Summary (knowing what’s on the floor), and Client Re-Engagement (clients without a job in 12+ months — your prime callback list). The Projected Income report is also useful for cash flow planning when invoices are out but unpaid.
How do I run a sales tax report for filing?
Open Sales Tax Liability, set the date range to the filing period (most states are monthly or quarterly), and review the taxable vs non-taxable totals. Export to CSV/Excel for your accountant or to feed into your filing system. See Export report data.
How do I track install crew commissions?
Use the Commissions report under Reports → Commissions (covered in Track commission payouts). For broader work analysis (jobs by installer, units installed by month), the Jobs report with installer-as-filter gives you the volume picture.
Why is the Inventory Summary report different from what I see in my Products list?
The Inventory Summary report freezes counts at the moment you opened it. The Products list updates in real time. If you reopened the report after running it, the numbers may differ from a brand-new run if invoices or POs were processed in between.
Can I see revenue by salesperson?
Use the Jobs or Invoices report and filter by Assigned To (the salesperson). Combined with date range, you get sold revenue per associate. For commission specifically (which factors in exclusions), use the Commissions report instead.
How is Projected Income calculated?
Sum of invoices in Unpaid status (sent to client, not yet paid). It excludes drafts and paid invoices. Useful as a cash-flow estimate but not a guarantee — invoices can be partially paid, refunded, or written off later.
My report looks empty — what should I check?
Three things: (1) date range — is it set to a period with actual activity? (2) status filter — is it filtering out the records you want (e.g., showing only Paid when you want Unpaid)? (3) location filter — is it scoped to a branch with no data?